6 West Hawaii Real Estate | July 20 2018
MLS Statistics West Hawaii sees year-to-year increase in prices
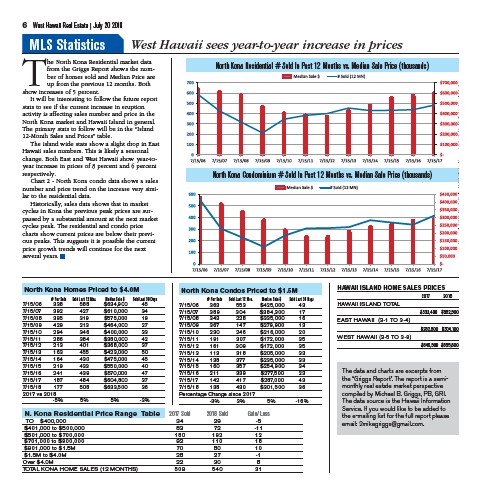
The North Kona Residential market data
from the Griggs Report shows the number
of homes sold and Median Price are
up from the previous 12 months. Both
show increases of 5 percent.
It will be interesting to follow the future report
stats to see if the current increase in eruption
activity is affecting sales number and price in the
North Kona market and Hawaii Island in general.
The primary stats to follow will be in the “Island
12-Month Sales and Prices” table.
The island wide stats show a slight drop in East
Hawaii sales numbers. This is likely a seasonal
change. Both East and West Hawaii show year-toyear
increase in prices of 8 percent and 6 percent
respectively.
Chart 2 - North Kona condo data shows a sales
number and price trend on the increase very similar
to the residential data.
Historically, sales data shows that in market
cycles in Kona the previous peak prices are surpassed
by a substantial amount at the next market
cycles peak. The residential and condo price
charts show current prices are below their previous
peaks. This suggests it is possible the current
price growth trends will continue for the next
several years.
North Kona Residential # Sold In Past 12 Months vs. Median Sale Price (thousands)
North Kona Condominium # Sold In Past 12 Months vs. Median Sale Price (thousands)
The data and charts are excerpts from
the “Griggs Report”. The report is a semimonthly
real estate market perspective
compiled by Michael B. Griggs, PB, GRI.
The data source is the Hawaii Information
Service. If you would like to be added to
the e-mailing list for the full report please
email: 2mikegriggs@gmail.com.
North Kona Homes Priced to $4.0M
# For Sale Sold Last 12 Mos. Median Sale $ Sold Last 30 Days
7/15/06 338 588 $634,900 45
7/15/07 392 427 $610,000 34
7/15/08 395 319 $575,000 19
7/15/09 429 213 $464,000 27
7/15/10 294 346 $400,000 33
7/15/11 286 384 $380,000 42
7/15/12 213 401 $368,000 37
7/15/13 163 455 $423,000 50
7/15/14 164 430 $475,000 45
7/15/15 219 433 $550,000 40
7/15/16 241 439 $570,000 47
7/15/17 187 484 $604,800 37
7/15/18 177 508 $633,500 36
2017 vs 2018
-5% 5% 5% -3%
N orth Kona Condos Priced to $1.5M
# For Sale Sold Last 12 Mos. Median Sale $ Sold Last 30 Days
7/15/06 363 553 $425,000 43
7/15/07 389 304 $384,300 17
7/15/08 343 228 $335,000 16
7/15/09 367 147 $279,900 13
7/15/10 230 246 $216,000 20
7/15/11 191 307 $172,000 35
7/15/12 161 309 $172,000 35
7/15/13 113 318 $205,000 33
7/15/14 138 377 $235,000 33
7/15/15 160 357 $254,900 34
7/15/16 211 339 $277,500 23
7/15/17 142 417 $287,000 43
7/15/18 138 430 $301,500 36
Percentage Change since 2017
-3% 3% 5% -16%
N. Kona Residential Price Range Table 2017 Sold 2018 Sold Gain/Loss
TO $400,000 34 29 -5
$401,000 to $500,000 83 72 -11
$501,000 to $700,000 180 192 12
$701,000 to $900,000 92 110 18
$901,000 to $1.5M 70 80 10
$1.5M to $4.0M 28 27 -1
Over $4.0M 22 30 8
TOTAL KONA HOME SALES (12 MONTHS) 509 540 31
Cprovider,Loan Performance The report 4.2 percent some stage or more foreclosure)a 0.6 the overall with 4.8 percent.
As of inventory share of of the foreclosure percent, from 0.7 August 2017,rate has been the lowest it was also foreclosure lowest for was also Measuring rates is important
HAWAII ISLAND HOME SALES PRICES
2017 2018
HAWAII ISLAND TOTAL
$533,400 $582,900
EAST HAWAII (3-1 TO 3-4)
$282,800 $304,100
WEST HAWAII (3-5 TO 3-9)
$846,900 $895,800
link