6 West Hawaii Real Estate | March 2, 2018
MLS Statistics
The North Kona Residential market data from the Griggs
Report continues on an upward trend. The number of
homes sold and Median Price are up from the previous 12
months. The result of the strong sales activity is a dwindling
supply of homes for sale. The strong demand and
shrinking supply will continue to drive prices higher.
You can see in the Price Range table that the greatest increase
in sales is in the $500,000 to $900,000 price ranges with
53 more homes sold than in the previous 12 month period.
The under $500,000 price ranges shows the greatest decline
due to lack of inventory. Inventory of homes priced
below $500,000 stands at 12 homes.
The Island 12 Month Sales Data shows Residential Sales
Numbers and Average Prices are up islandwide. The more
affordable East Hawaii market is showing the greatest
price increase.
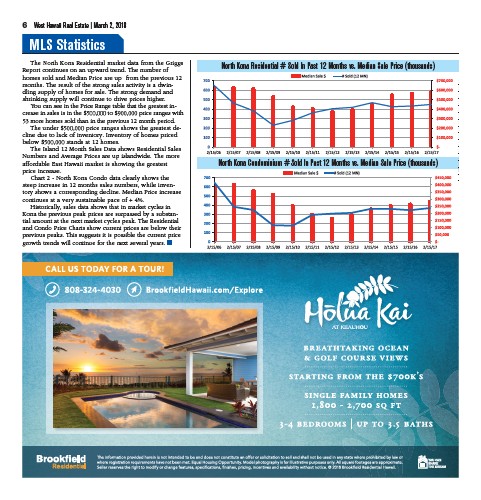
Chart 2 - North Kona Condo data clearly shows the
steep increase in 12 months sales numbers, while inventory
shows a corresponding decline. Median Price increase
continues at a very sustainable pace of + 4%.
Historically, sales data shows that in market cycles in
Kona the previous peak prices are surpassed by a substantial
amount at the next market cycles peak. The Residential
and Condo Price Charts show current prices are below their
previous peaks. This suggests it is possible the current price
growth trends will continue for the next several years.
North Kona Residential # Sold In Past 12 Months vs. Median Sale Price (thousands)
North Kona Condominium # Sold In Past 12 Months vs. Median Sale Price (thousands)
North Kona 2/15/06 2/15/07 2/15/08 2/15/09 2/15/10 2/15/11 2/15/12 2/15/13 2/15/14 2/15/15 2/15/16 2/15/17 2/15/18 Percentage